Nguồn: Ielts Simon
Trong bài viết này, các bạn hãy cùng IZONE phân tích lối viết của giám khảo Simon và hoàn thiện bài writing task 1 sau đây nhé!
Đề bài: The charts below show the levels of participation in education and science in developing and industrialised countries in 1980 and 1990.

A. Translation (Dịch)
Trước khi đi sâu vào phân tích cấu trúc bài Ielts Writing Task 1 trên, các bạn hãy làm bài dịch sau để có thể củng cố thêm từ vựng và ngữ pháp khi gặp đề writing này nhé.
(Nhấn vào đây để xem hướng dẫn)
Introduction
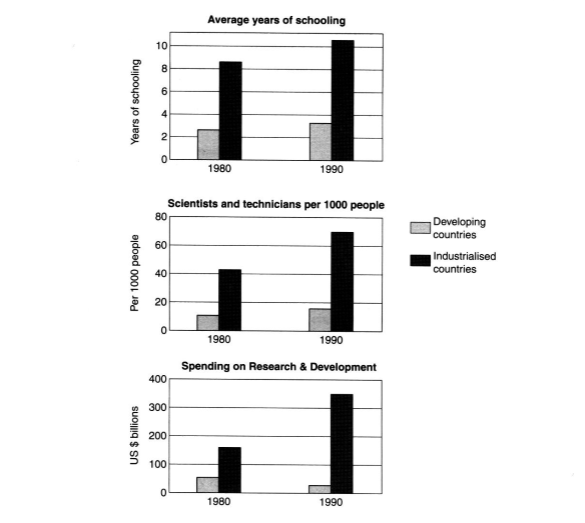
Ba biểu đồ cột cho thấy số năm đi học trung bình, số lượng nhà khoa học và kỹ thuật viên, và chi tiêu cho nghiên cứu và phát triển ở các nước đang phát triển và các nước phát triển. Các con số được đưa ra cho năm 1980 và 1990.
Dịch
Vocabulary:
years of schooling
average (adj)
figures (n)
Grammar:
Subject-verb agreement: The three bar charts show
Countable nouns: scientists, technicians, years
Uncountable nouns: research and development spending
Passive voice: be + past participle (give – gave -given)
Plural noun (countable): figures
The three bar charts show average years of schooling, numbers of scientists and technicians, and research and development spending in developing and developed countries. Figures are given for 1980 and 1990.
Overview
Rõ ràng là từ các biểu đồ, các con số của các nước phát triển cao hơn nhiều so với các con số của các nước đang phát triển.
Dịch
Vocabulary:
figure for
developed countries
Grammar:
Chủ ngữ giả: It is clear that
Comparatives: much higher than (short adj + er + than …)
Pronoun use: “those” được dùng để tránh lặp lại từ “figures”
It is clear from the charts that the figures for developed countries are much higher than those for developing nations.
Ngoài ra, các biểu đồ cho thấy một sự gia tăng tổng thể trong việc tham gia vào giáo dục và khoa học từ năm 1980 đến năm 1990.
Dịch
Vocabulary:
overall increase
participation (n)
Grammar:
Noun phrases: increase in + noun; participation in + noun
The indefinite article: an + singular noun (an overall increase)
Also, the charts show an overall increase in participation in education and science from 1980 to 1990.
Body Paragraph 1
Người dân ở các nước đang phát triển đi học trung bình khoảng 3 năm,
Dịch
Vocabulary:
attend school (v)
Grammar:
Past simple: attend – attended
for + khoảng thời gian: dùng để diễn tả khoảng thời gian hoạt động diễn ra ở thì quá khứ
People in developing nations attended school for an average of around 3 years,
… với chỉ một sự tăng nhẹ trong số năm đi học từ 1980 đến 1990.
Dịch
Vocabulary:
slight (adj)
Grammar:
The indefinite article: a + adj + singular noun (a slight increase)
… with only a slight increase in years of schooling from 1980 to 1990.
Mặt khác, con số ở các nước công nghiệp hóa tăng từ gần 9 năm đi học vào năm 1980 lên gần 11 năm vào năm 1990.
Dịch
Vocabulary:
On the other hand
nearly (adv)
Grammar:
Past simple: rise – rose
The definite article: the + singular noun (the figure)
On the other hand, the figure for industrialised countries rose from nearly 9 years of schooling in 1980 to nearly 11 years in 1990.
Body paragraph 2
Từ năm 1980 đến 1990, số lượng các nhà khoa học và kỹ thuật viên ở các nước công nghiệp hoá gần như gấp đôi lên khoảng 70 trên mỗi 1000 người.
Dịch
Vocabulary:
double (v)
…. per … people
Grammar:
Noun phrases: the number of + noun
Past simple: double-doubled
From 1980 to 1990, the number of scientists and technicians in industrialised countries almost doubled to about 70 per 1000 people.
Chi tiêu cho nghiên cứu và phát triển cũng thấy sự gia tăng nhanh ở các quốc gia này, đạt 350 tỷ đô la vào năm 1990.
Dịch
Vocabulary:
rapid growth (n)
reach (v)
Grammar:
Rút gọn mệnh đề trạng ngữ:, reaching $350 billion …
Past simple: see-saw.
Spending on research and development also saw rapid growth in these countries, reaching $350 billion in 1990.
Ngược lại, số lượng người lao động khoa học ở các nước đang phát triển vẫn duy trì dưới 20 trên 1000 người,
Dịch
Vocabulary:
by contrast
remain (v)
Grammar:
Past simple: remain-remained
Linking words: By contrast, S+V
By contrast, the number of science workers in developing countries remained below 20 per 1000 people,
và chi tiêu cho nghiên cứu giảm từ khoảng 50 tỷ đô la xuống chỉ còn 25 tỷ đô la.
Dịch
Vocabulary:
research spending
Grammar:
Singular noun: spending (uncountable)
and research spending fell from about $50 billion to only $25 billion.
Để xem bài dịch hoàn thiện các bạn hãy nhấn vào đây nhé!
Introduction
The three bar charts show average years of schooling, numbers of scientists and technicians, and research and development spending in developing and developed countries. Figures are given for 1980 and 1990
Overview
It is clear from the charts that the figures for developed countries are much higher than those for developing nations. Also, the charts show an overall increase in participation in education and science from 1980 to 1990.
Body Paragraph 1
People in developing nations attended school for an average of around 3 years, with only a slight increase in years of schooling from 1980 to 1990. On the other hand, the figure for industrialised countries rose from nearly 9 years of schooling in 1980 to nearly 11 years in 1990.
Body Paragraph 2
From 1980 to 1990, the number of scientists and technicians in industrialised countries almost doubled to about 70 per 1000 people. Spending on research and development also saw rapid growth in these countries, reaching $350 billion in 1990. By contrast, the number of science workers in developing countries remained below 20 per 1000 people, and research spending fell from about $50 billion to only $25 billion.
B. Analyze (Phân Tích)
(Nhấn vào đây để xem hướng dẫn)
Sau khi đã dịch xong các câu trong phần A, các bạn hãy đưa ra nhận xét về vai trò của từng phần và câu trong bài writing trên nhé
Hãy nhấn vào đây để xem toàn bộ nội dung của bài!
Introduction
The line graph compares four sectors in terms of the amount of acid rain emissions that they produced over a period of 17 years in the UK.
Overview
It is clear that the total amount of acid rain emissions in the UK fell considerably between 1990 and 2007. The most dramatic decrease was seen in the electricity, gas and water supply sector.
Body Paragraph 1
In 1990, around 3.3 million tonnes of acid rain emissions came from the electricity, gas and water sector. The transport and communication sector was responsible for about 0.7 million tonnes of emissions, while the domestic sector produced around 0.6 million tonnes. Just over 2 million tonnes of acid rain gases came from other industries.
Body Paragraph 2
Emissions from electricity, gas and water supply fell dramatically to only 0.5 million tonnes in 2007, a drop of almost 3 million tonnes. While acid rain gases from the domestic sector and other industries fell gradually, the transport sector saw a small increase in emissions, reaching a peak of 1 million tonnes in 2005.
Introduction
The three bar charts show average years of schooling, numbers of scientists and technicians, and research and development spending in developing and developed countries. Figures are given for 1980 and 1990
Câu hỏi
Mục đích của phần introduction là gì?
Trả lời
Introduction (mở bài): giới thiệu biểu đồ nói về cái gì
The three bar charts show average years of schooling, numbers of scientists and technicians, and research and development spending in developing and developed countries. Figures are given for 1980 and 1990.
Câu hỏi
Biểu đồ nói về cái gì? (What?) Tại địa điểm nào? (Where?) Tại thời gian nào? (When?) Các nhóm đối tượng chính của biểu đồ là gì? (Categories?) Đơn vị của biểu đồ là gì (Unit?)
Trả lời
What: levels of participation in education and science
Place: developing and developed countries
Time: 1980 and 1990
Categories: 3 loại dữ liệu: average years of schooling, numbers of scientists and technicians, research and development spending
Unit: years, people, US$ billions
Giải thích
Trong câu mở bài, thường bao giờ cũng có các cấu thành What PTCU: (What Place, Time, Categories, Unit)
What: Tên số liệu (nói về cái gì)
Place: địa điểm phát sinh số liệu
Time: Thời gian phát sinh số liệu
Categories: số mục phân loại số liệu (3 loại dữ liệu: số năm đi học trung bình, số lượng nhà khoa học và kĩ thuật viên, chi tiêu cho nghiên cứu và phát triển)
Unit: đơn vị đo số liệu
Overview
It is clear from the charts that the figures for developed countries are much higher than those for developing nations. Also, the charts show an overall increase in participation in education and science from 1980 to 1990.
Câu hỏi
Mục đích của phần overview là gì?
Trả lời
Overview (tổng quan): Nêu những điều người xem chỉ cần mới xem qua hình ảnh biểu đồ (chưa cần xem số liệu cụ thể) là đã có thể thấy được
Câu 1 – Overview
It is clear from the charts that the figures for developed countries are much higher than those for developing nations.
Câu hỏi
Nội dung của câu 1 phần này nói về điều gì?
Trả lời
Nội dung của câu 1: Sự so sánh tổng quan về số liệu giữa 2 nhóm quốc gia: số liệu chung của các nước phát triển cao hơn nhiều so với các nước đang phát triển
Giải thích thêm:
Dữ liệu trong bài được phân loại dựa trên 3 tiêu chí:
1) Nhóm quốc gia (phát triển vs. đang phát triển)
2) Loại dữ liệu: 3 loại,chính là 3 Categories phần Introduction
3) Thời điểm lấy số liệu: 2 năm trước – sau
Đoạn Overview cần nói đến cả 3 tiêu chí này. Câu Overview 1 này đã nói được tiêu chí 1 – so sánh chung giữa 2 nhóm quốc gia
Câu 2 – Overview
Also, the charts show an overall increase in participation in education and science from 1980 to 1990.
Câu hỏi
Nội dung của câu 2 phần này nói về điều gì?
Trả lời
Nội dung của câu 2: Xu hướng tăng chung trong việc tham gia vào giáo dục và khoa học ở cả 2 nhóm quốc gia
Giải thích thêm: So sánh giữa 2 năm (tiêu chí 3): từ năm đầu tiên qua năm thứ 2 có sự tăng của 2 trên 3 categories (tiêu chí 2)
Body paragraph 1
People in developing nations attended school for an average of around 3 years, with only a slight increase in years of schooling from 1980 to 1990. On the other hand, the figure for industrialised countries rose from nearly 9 years of schooling in 1980 to nearly 11 years in 1990.
Câu hỏi
Mục đích của phần paragraph 1 là gì?
Trả lời
Body paragraph 1 (Thân bài 1): So sánh loại số liệu đầu tiên (average years of schooling) của 2 nhóm quốc gia
Câu 1 – Body 1
People in developing nations attended school for an average of around 3 years, with only a slight increase in years of schooling from 1980 to 1990.
Câu hỏi
Nội dung của câu 1 phần này nói về điều gì?
Trả lời
Nội dung của câu 1: nêu số liệu “average years of schooling” của các nước đang phát triển – around 3 years và từ đó cũng chỉ ra xu hướng tăng nhẹ của số liệu này từ 1980-1990.
Giải thích thêm:
Trong trường hợp này, chỉ có 2 năm được đưa ra (1980 và 1990), nên thường số liệu của cả 2 năm sẽ được nêu rõ.
Ở đây số liệu năm đầu và năm sau khá gần nhau , nên được gộp chung lại nói 1 lần (khoảng 3 năm).
Câu 2 – Body 1
On the other hand, the figure for industrialised countries rose from nearly 9 years of schooling in 1980 to nearly 11 years in 1990.
Câu hỏi
Nội dung của câu 2 phần này nói về điều gì?
Trả lời
Nội dung của câu 2: nêu số liệu “average years of schooling” của các nước công nghiệp hóa – nearly 9 years in 1980 and 11 years in 1990 và từ đó cũng chỉ ra xu hướng tăng của số liệu này từ 1980-1990
Giải thích thêm:
Đưa ra số liệu của các nước phát triển, để so sánh với tình hình ở câu 1.
Ở đây có 2 thông tin chính được đưa ra
– Kết nối – so sánh với câu (1): nếu như câu 1 chỉ có 1 sự tăng nhẹ (slight increase) thì ở đây có sự thay đổi đáng chú ý hơn (Từ 9 đến 11 năm)
– Nêu rõ số liệu của cả 2 năm (9 years & 11 years)
Body Paragraph 2
From 1980 to 1990, the number of scientists and technicians in industrialised countries almost doubled to about 70 per 1000 people. Spending on research and development also saw rapid growth in these countries, reaching $350 billion in 1990. By contrast, the number of science workers in developing countries remained below 20 per 1000 people, and research spending fell from about $50 billion to only $25 billion.
Câu hỏi
Mục đích của phần paragraph 2 là gì?
Trả lời
Body paragraph 2 (Thân bài 2): So sánh 2 loại số liệu còn lại của 2 nhóm quốc gia
Câu 1 – Body 2
From 1980 to 1990, the number of scientists and technicians in industrialised countries almost doubled to about 70 per 1000 people.
Câu hỏi
Nội dung của câu 1 phần này nói về điều gì?
Trả lời
Nội dung của câu 1: nêu xu hướng tăng mạnh từ năm 1980-1990 (tăng gần gấp đôi) về số lượng các nhà khoa học và kỹ thuật viên ở các nước phát triển (tăng 70 người trên 1000 người)
Giải thích thêm:
Nội dung nổi bật của đoạn này: 2 số liệu của nhóm nước PHÁT TRIỂN thì tăng mạnh, còn các nước ĐANG PHÁT TRIỂN thì 1 số liệu tăng nhẹ, 1 số liệu thậm chí còn giảm.
Tác giả bắt đầu Câu 1 Body 2 này bằng cách chỉ ra sự tăng mạnh của nhóm số liệu đầu tiên (Số lượng KTV và nhà khoa học) ở nước PHÁT TRIỂN & số liệu cụ thể.
Câu 2 – Body 2
Spending on research and development also saw rapid growth in these countries, reaching $350 billion in 1990.
Câu hỏi
Nội dung của câu 2 phần này nói về điều gì?
Trả lời
Nội dung của câu 2: chỉ ra sự tăng trưởng nhanh trong việc chi tiêu cho nghiên cứu và phát triển ở những nước phát triển, đạt $350 tỉ vào năm 1990
Giải thích thêm: So sánh 3 ngành còn lại, trong đó có 2 ngành có xu hướng giống nhau (“other industries” và “domestic”) được nói gộp lại, còn ngành cuối cùng (transport) thì khác => nói riêng ra.
Chỉ ra sự tương đồng trong xu hướng với câu 1: cũng tăng mạnh.
Chỉ ra sự tương đồng: nhóm số liệu thứ 2 ở các nước PHÁT TRIỂN (Chi tiêu cho nghiên cứu) cũng có sự tăng mạnh. Sử dụng liên từ “also” để nối ý 2 câu.
Câu 3 – Body 2
By contrast, the number of science workers in developing countries remained below 20 per 1000 people, and research spending fell from about $50 billion to only $25 billion.
Câu hỏi
Nội dung của câu 3 phần này nói về điều gì?
Trả lời
Nội dung của câu 3: Chỉ ra số lượng thấp các nhà khoa học (20 trên 1000 người) và xu hướng giảm chung của chi tiêu cho nghiên cứu và phát triển ở những nước đang phát triển (giảm từ 50 tỉ xuống 25 tỉ)
C. Bảng Tổng Hợp Từ Vựng
| Từ vựng | Nghĩa |
|---|---|
| years of schooling (n) The three bar charts show average years of schooling, numbers of scientists and technicians, and research and development spending in developing and developed countries. | số năm đi học trung bình Ba biểu đồ cột cho thấy số năm đi học trung bình, số lượng nhà khoa học và kỹ thuật viên, và chi tiêu cho nghiên cứu và phát triển ở các nước đang phát triển và các nước phát triển. |
| average (adj) The three bar charts show average years of schooling, numbers of scientists and technicians, and research and development spending in developing and developed countries | trung bình Ba biểu đồ cột cho thấy số năm đi học trung bình, số lượng nhà khoa học và kỹ thuật viên, và chi tiêu cho nghiên cứu và phát triển ở các nước đang phát triển và các nước phát triển. |
| figures (n) Figures are given for 1980 and 1990. | Các con số Các con số được đưa ra cho năm 1980 và 1990. |
| figure for It is clear from the charts that the figures for developed countries are much higher than those for developing nations. | các con số của Rõ ràng là từ các biểu đồ, các con số của các nước phát triển cao hơn nhiều so với các con số của các nước đang phát triển. |
| developed countries (n) It is clear from the charts that the figures for developed countries are much higher than those for developing nations. | các nước phát triển Rõ ràng là từ các biểu đồ, các con số của các nước phát triển cao hơn nhiều so với các con số của các nước đang phát triển. |
| overall increase (n) Also, the charts show an overall increase in participation in education and science from 1980 to 1990. | sự gia tăng tổng thể Ngoài ra, các biểu đồ cho thấy một sự gia tăng tổng thể trong việc tham gia vào giáo dục và khoa học từ năm 1980 đến năm 1990. |
| participation (n) Also, the charts show an overall increase in participation in education and science from 1980 to 1990. | việc tham gia Ngoài ra, các biểu đồ cho thấy một sự gia tăng tổng thể trong việc tham gia vào giáo dục và khoa học từ năm 1980 đến năm 1990. |
| attend school (v) People in developing nations attended school for an average of around 3 years, | đi họcNgười dân ở các nước đang phát triển đi học trung bình khoảng 3 năm, |
| slight (adj) with only a slight increase in years of schooling from 1980 to 1990. | nhẹ với chỉ một sự tăng nhẹ trong số năm đi học từ 1980 đến 1990. |
| On the other hand On the other hand, the figure for industrialised countries rose from nearly 9 years of schooling in 1980 to nearly 11 years in 1990. | Mặt khác Mặt khác, con số ở các nước công nghiệp hóa tăng từ gần 9 năm đi học vào năm 1980 lên gần 11 năm vào năm 1990. |
| nearly (adv) On the other hand, the figure for industrialised countries rose from nearly 9 years of schooling in 1980 to nearly 11 years in 1990. | gần như Từ năm 1980 đến 1990, số lượng các nhà khoa học và kỹ thuật viên ở các nước công nghiệp hoá gần như gấp đôi lên khoảng 70 trên mỗi 1000 người. |
| double (v) From 1980 to 1990, the number of scientists and technicians in industrialised countries almost doubled to about 70 per 1000 people. | gấp đôi Từ năm 1980 đến 1990, số lượng các nhà khoa học và kỹ thuật viên ở các nước công nghiệp hoá gần như gấp đôi lên khoảng 70 trên mỗi 1000 người. |
| rapid growth (n) Spending on research and development also saw rapid growth in these countries, reaching $350 billion in 1990. | sự gia tăng nhanh Chi tiêu cho nghiên cứu và phát triển cũng thấy sự gia tăng nhanh ở các quốc gia này, đạt 350 tỷ đô la vào năm 1990. |
| …. per … people By contrast, the number of science workers in developing countries remained below 20 per 1000 people, | bao nhiêu trên bao nhiêu người Ngược lại, số lượng người lao động khoa học ở các nước đang phát triển vẫn duy trì dưới 20 trên 1000 người, |
| reach (v) Spending on research and development also saw rapid growth in these countries, reaching $350 billion in 1990. | đạt Chi tiêu cho nghiên cứu và phát triển cũng thấy sự gia tăng nhanh ở các quốc gia này, đạt 350 tỷ đô la vào năm 1990. |
| by contrast By contrast, the number of science workers in developing countries remained below 20 per 1000 people, | ngược lại Ngược lại, số lượng người lao động khoa học ở các nước đang phát triển vẫn duy trì dưới 20 trên 1000 người, |
| remain (v) By contrast, the number of science workers in developing countries remained below 20 per 1000 people, | duy trì Ngược lại, số lượng người lao động khoa học ở các nước đang phát triển vẫn duy trì dưới 20 trên 1000 người, |
| research spending (n) and research spending fell from about $50 billion to only $25 billion. | chi tiêu cho nghiên cứu và chi tiêu cho nghiên cứu giảm từ khoảng 50 tỷ đô la xuống chỉ còn 25 tỷ đô la. |
D. Rewrite (Viết lại)
Sau khi đã nắm vững các từ vựng, ngữ pháp và cấu trúc của bài viết các bạn hãy viết lại bài theo định hướng sau nhé!
Đề bài: The charts below show the levels of participation in education and science in developing and industrialised countries in 1980 and 1990.
Intro – 1 câu đưa thông tin giới thiệu biểu đồ nói về cái gì
What: levels of participation in education and science
Place: developing and developed countries
Time: 1980 and 1990
Categories: 3 loại dữ liệu: average years of schooling, numbers of scientists and technicians, research and development spending
Unit: years, people, US$ billions
Overview – 2 câu
Overview 1: So sánh tổng quan về số liệu giữa 2 đối tượng: số liệu của các nước phát triển cao hơn các nước đang phát triển
Overview 2: Xu hướng tăng chung trong việc tham gia vào giáo dục và khoa học ở cả 2 đối tượng
Body 1 – 2 câu
Câu 1 – Body 1 – nêu số liệu “average years of schooling” của các nước đang phát triển và chỉ ra xu hướng tăng nhẹ của số liệu này từ 1980-1990.
Câu 2 – Body 1 – nêu số liệu “average years of schooling” của các nước công nghiệp hóa – và chỉ ra xu hướng tăng của số liệu này từ 1980-1990
Body 2 – 3 câu
Câu 1 – Body 2 – nêu xu hướng tăng mạnh từ năm 1980-1990 (tăng gấp đôi) về số lượng các nhà khoa học và kĩ thuật viên ở các nước phát triển (tăng 70 người trên 1000 người)
Câu 2 – Body 2 – chỉ ra sự tăng trưởng nhanh trong việc chi tiêu cho nghiên cứu và phát triển ở những nước phát triển, đạt $350 tỉ vào năm 1990
Câu 3 – Body 2 – Chỉ ra sự đối lập ở các nước đang phát triển: số lượng các nhà khoa học thấp (20 trên 1000 người) và xu hướng giảm chung của chi tiêu cho nghiên cứu và phát triển (giảm từ 50 tỉ xuống 25 tỉ)
Bài làm